A correlation matrix is a graph that shows the correlation between all data sets. You can see the correlation on this graph above. On the left the data is scattered, but on the right, a correlation matrix is made, and the similarity in colors shows the correlation of all the date.
Anna's Map Catalog
Sunday, July 17, 2011
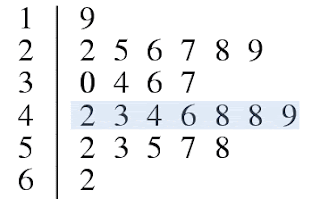
Stem and Leaf Plot
A stem and leaf plot is a way to distribute data with part of the data on the left, or the "stem," and half on the right, as the "leaf". It is a way to put data together and show the distribution of values. For example if you were making a plot of the ages of people in a group, you could you this, and if this above stem and leaf plot were ages, the most people would be in their forties, and the least in their 60's and teens.
Box Plot
A box plot is a statistical tool that shows the distribution of five number summaries. This is a basic box plot, and the length between each percentile, means that area is bigger, so since the box between the 50th and 25th percentile is small, that would mean the least amount of the data fell in that level.
Histogram
A histogram is like a bar graph, and is a chart of data points in different ranges. They are usually a rough approximation of the distribution of data where data is just put into ranges. This is a histogram of test scores, and you can see that all A's are lumped together, all B's, and so on, making it a rough distribution.
Parallel Coordinate Graph
A parallel coordinate graph is used to plot data sets with many variates and see it all side by side. As you can see on this graph, there are many many variables all being graphed on the same graph each with a different line.
Triangular Plot
A triangular plot is a graph with three variable rather than the common two. The propotions of these three variables sum to a constant of 100 so if you know two of the variables you can figure out the third. This is a triangular plot of sand silt and clay. These graphs would be useful when you are trying to figure out the right levels of three things, since they always have to add up.
Windrose
A windrose is a meteorology tool used to calculate and show windspeed and direction of an area. This windrose shows that the wind blew with the highest speed to the south, and the colors and arms of the windrose show the direction and speed of the wind.
Subscribe to:
Comments (Atom)


