
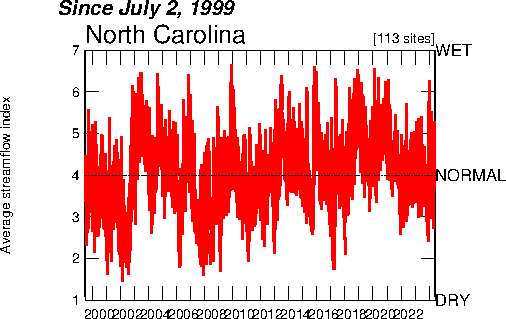
Index value plots are a type of line graph where the data can be compared to an average level, rather than start at zero. This graph shows the stream flows and how they vary from normal to dry or up to wet. The index value is the normal streamflow that we base the variations off of.
No comments:
Post a Comment