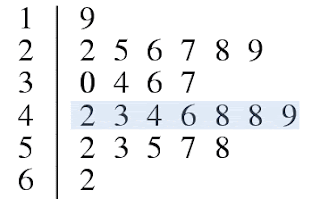
A stem and leaf plot is a way to distribute data with part of the data on the left, or the "stem," and half on the right, as the "leaf". It is a way to put data together and show the distribution of values. For example if you were making a plot of the ages of people in a group, you could you this, and if this above stem and leaf plot were ages, the most people would be in their forties, and the least in their 60's and teens.

No comments:
Post a Comment